Google Analytics is not a software that you might use unless you have a website and like to get statistics about a website. But if you do have a Google Analytics account and use Android the new update is a welcome change
 The prior version of Google Analytics, although not lacking in options for line chart data, did not offer much more. Each chart required individual manual setup, which is fine if you only had 1 or 2 sites, but painstaking for 10 or more sites. Real-time monitoring, standard and custom alerts were available as well, but in some cases required setup from the browser interface.
The new, updated version of Google Analytics runs along the design and style of the majority of Google's apps and products. The colors and formatting are smooth and the layout is much more fluid to fit a smaller mobile screen. Much more attention was given to the default features available for each site.
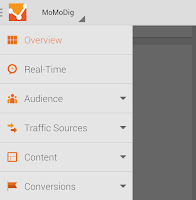
 Just like in the browser version, from the left can be found the menu of all the various features and options. Starting from the top where select dates can be chosen or customized there follows five sections to scroll through, including Real-Time, Audience, Traffic Sources, Content, and Conversions. Some of my particular favorites are what would seem to be the most desirable display options. In the Audience default the total number of visits is displayed including a listing of all the nations and their count of visitors. In the Traffic Sources section the total page visits is displayed with a colorful circle chart. And yet still in the Content section, Page Views are displayed in a one-weekly calendar format with darkened spaces per hour depending on the volume of visitors.
It is still possible to find the line charts from the prior version of Google Analytics. By selecting the menu each overview in the five primary sections will display a default line chart plus alternative corresponding charts depending on the data. But it would be nice to be able to setup your own custom chart displays.
With this new layout, Google is meeting the requests of the users to make charts and graphs that are standardized at the outset. If they plan on making changes, hopefully it will be synchronizable between the app and browser.
Check it out on the Google Play Store, sorry iOS users, there's no "official" app for you.

No comments:
Post a Comment